 Netherlands
 Belgium
 Denmark
 Germany
 France
 Switzerland
 Austria
 UK
UK Spain
Spain Italy
ItalyView Call Statistics Percentages by Time or Origin
For many number owners, it is important to know what portion of calls occur outside business hours or how many calls come from mobile callers.
Belfabriek offers its customers extensive real-time call statistics where such data is visible at a glance.
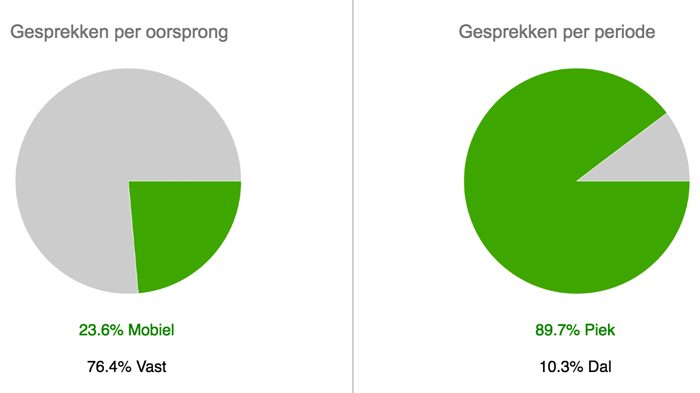
Peak/Off-Peak and Mobile/Landline Graphs
After logging into your online My Belfabriek dashboard, go to Statistics.
At the top of the page, you will see handy graphs showing the share of calls that occur during peak or off-peak hours, as well as the share of calls from mobile and landline callers.
Further Breakdowns
When you scroll further, you will see graphs with breakdowns by day of the week and the top 3 busiest hours, as well as the locations of your callers and top destinations.
All these statistics quickly give you insight into how your number is performing. You can immediately see where employees are most burdened.